


Lurking in the Shadows: A Closer Look at Multidimensional Poverty in Sri Lanka


.png )
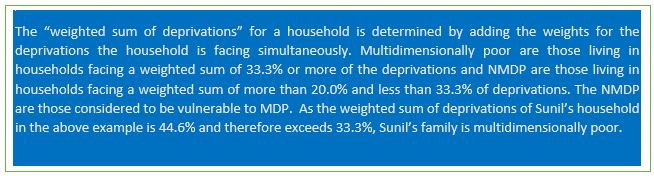
Sunil is a labourer who lives in a small hut with his wife, and their two children, aged seven and four years. Both Sunil and his wife have had schooling only up to grade five. Their hut has no electricity or proper sanitation facilities. The elder child is not in school yet. It is clear that Sunil and his family are facing many deprivations simultaneously, and low income is just one dimension of poverty.
Multidimensional Poverty (MDP) is an effective measure that captures the many different deprivations faced by the poor. Unlike income poverty, MDP takes into consideration the different types of deprivations that individuals experience simultaneously. The Alkire-Foster Method (AFM), that gauges MDP, involves three dimensions, health, education, and living standards, which are measured through 10 indicators. Figure 1 shows the dimensions, the indicators (deprivations), and the relevant weights used in this analysis. The MDP reveals the types of deprivations faced by the poor, poverty levels in different regions of the country, and the different sub groups suffering from poverty. It also identifies different types of deprivations, which can help determine region-specific strategies to combat poverty and inequality.
This analysis, based on the Household Income and Expenditure Survey 2016 (HIES-2016), examines the different groups that face MDP, where they live, and the types of deprivations, as well as the percentages of the deprivations they face. It examines both MDP and those in Near Multidimensional Poverty (NMDP).
 Contributions of Deprivations to MDP and NMDP
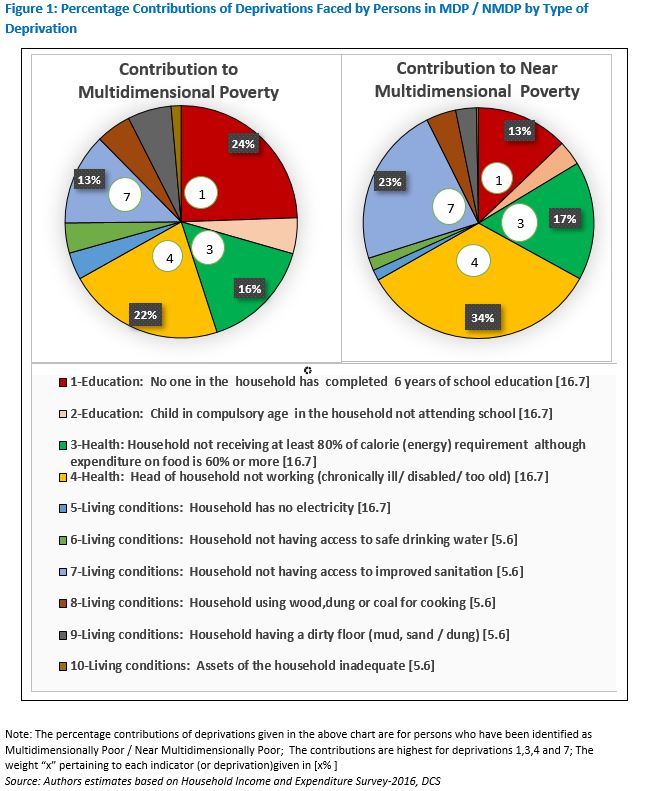
The first pie chart in Figure 1 show the magnitude of the contributions of deprivations to MDP. The second shows the corresponding contributions to NMDP. It is clear that the highest contributions to MDP and NMDP are from deprivations 1, 3, 4, and 7. For MDP, the highest contribution (24.5%) is from the lack of education; no one in the household has 6 years of education. This is followed by the two health-related deprivations, and the lack of access to improved sanitation. These four elements make up almost 75% of the deprivations contributing to MDP. In the case of NMDP, the main contribution is related to inability to work; head of the household is not working due to a chronical illness, disability or old age. This amounts to 33.9%. The other main deprivations are related to education, health, and sanitation. These four aspects account for 86.1% of deprivations contributing to NMDP.
Contributions of Deprivations to MDP and NMDP
The first pie chart in Figure 1 show the magnitude of the contributions of deprivations to MDP. The second shows the corresponding contributions to NMDP. It is clear that the highest contributions to MDP and NMDP are from deprivations 1, 3, 4, and 7. For MDP, the highest contribution (24.5%) is from the lack of education; no one in the household has 6 years of education. This is followed by the two health-related deprivations, and the lack of access to improved sanitation. These four elements make up almost 75% of the deprivations contributing to MDP. In the case of NMDP, the main contribution is related to inability to work; head of the household is not working due to a chronical illness, disability or old age. This amounts to 33.9%. The other main deprivations are related to education, health, and sanitation. These four aspects account for 86.1% of deprivations contributing to NMDP.
 Who are Battered by Multiple Deprivations?
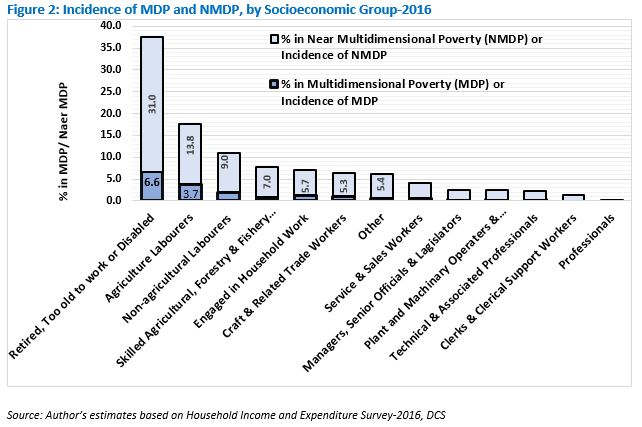
Although the incidence of MDP in Sri Lanka is only 1.9% (around 400,000 persons), nearly 10% of the population or around two million people are in NMDP, which means they can slip into the former easily. Altogether, 2.4 million people (or 11.5% of the population) in Sri Lanka are either in MDP or NMDP. Figure 2 shows that households headed by persons who are retired / too old to work / disabled is the main socioeconomic group (SEG) facing multiple deprivations. This group records the highest incidence of MDP of 6.6% and NMDP of 31%. More than half of the people who are either in MDP or NMDP belong to this group. The other three SEGs with high shares of MDP or NMDP consist of households headed by agricultural labourers, non-agricultural labourers and skilled agricultural, forestry, and fishery workers. These four groups accounts for nearly 80% of those in MDP or NMDP.
Who are Battered by Multiple Deprivations?
Although the incidence of MDP in Sri Lanka is only 1.9% (around 400,000 persons), nearly 10% of the population or around two million people are in NMDP, which means they can slip into the former easily. Altogether, 2.4 million people (or 11.5% of the population) in Sri Lanka are either in MDP or NMDP. Figure 2 shows that households headed by persons who are retired / too old to work / disabled is the main socioeconomic group (SEG) facing multiple deprivations. This group records the highest incidence of MDP of 6.6% and NMDP of 31%. More than half of the people who are either in MDP or NMDP belong to this group. The other three SEGs with high shares of MDP or NMDP consist of households headed by agricultural labourers, non-agricultural labourers and skilled agricultural, forestry, and fishery workers. These four groups accounts for nearly 80% of those in MDP or NMDP.
 Spatial Distribution of Persons in MDP or NMDP
The regions where a majority of the people in MDP or NMDP lives should be identified to develop area-specific strategies. In Sri Lanka, the highest number of persons in MDP or NMDP are in the Kandy district (9% out of the total number in MDP or NMDP in the country). Other districts with high shares of MDP or NMDP are Kurunegala (8%), Ratnapura (7.5%), Gampaha (6.6%), Galle (5.6%), and Matara (5%). It is also necessary to consider the incidence of MDP or NMDP or the percentages of persons in MDP or NMDP within each district. The incidence is highest in the Batticaloa district (19.5%), followed by Trincomalee (18.2%), Mullaitivu (16.4%), Kilinochchi (15.9%), Ratnapura (15.9%), and Kandy (15.4%). While the incidence of MDP and NMDP is low in some districts, the number of people living in poverty in absolute terms are high.
Spatial Distribution of Persons in MDP or NMDP
The regions where a majority of the people in MDP or NMDP lives should be identified to develop area-specific strategies. In Sri Lanka, the highest number of persons in MDP or NMDP are in the Kandy district (9% out of the total number in MDP or NMDP in the country). Other districts with high shares of MDP or NMDP are Kurunegala (8%), Ratnapura (7.5%), Gampaha (6.6%), Galle (5.6%), and Matara (5%). It is also necessary to consider the incidence of MDP or NMDP or the percentages of persons in MDP or NMDP within each district. The incidence is highest in the Batticaloa district (19.5%), followed by Trincomalee (18.2%), Mullaitivu (16.4%), Kilinochchi (15.9%), Ratnapura (15.9%), and Kandy (15.4%). While the incidence of MDP and NMDP is low in some districts, the number of people living in poverty in absolute terms are high.
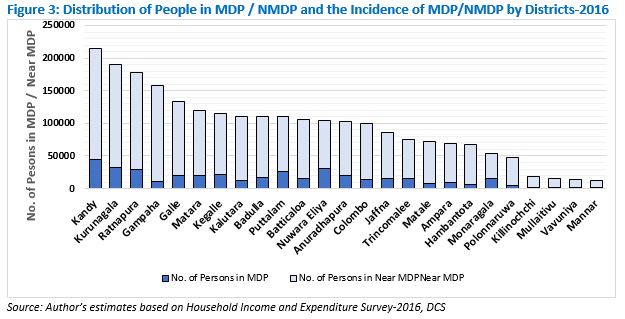 Figure 3 shows that the number of persons in NMDP in almost all districts is considerably high compared to those in MDP. This indicates that, although the incidence of MDP is low in Sri Lanka, a large number of people are at risk of slipping into MDP.
Monitoring all Dimensions of Poverty
The strategies to minimise MDP and NMDP depend on the types of deprivations faced by the poor, their locations, and their socioeconomic groups. Continuous monitoring of all dimensions of poverty and identifying the most threatened regions and groups are essential to eliminate all forms of poverty. Such information will be useful in developing region specific strategies.
As shown in Figure 1, there are four major deprivations contributing to MDP and to NMDP. If these four deprivations could be minimised or eliminated, it would be possible to eliminate MDP. Ensuring at least eight years of quality education for all, additional attention to households headed by persons who are unable to work, targeted measures to combat undernutrition, and the provision of sanitation facilities to deprived households are some of the interventions that can help in this regard.
Written by Wimal Nanayakkara for IPS Research Team
Figure 3 shows that the number of persons in NMDP in almost all districts is considerably high compared to those in MDP. This indicates that, although the incidence of MDP is low in Sri Lanka, a large number of people are at risk of slipping into MDP.
Monitoring all Dimensions of Poverty
The strategies to minimise MDP and NMDP depend on the types of deprivations faced by the poor, their locations, and their socioeconomic groups. Continuous monitoring of all dimensions of poverty and identifying the most threatened regions and groups are essential to eliminate all forms of poverty. Such information will be useful in developing region specific strategies.
As shown in Figure 1, there are four major deprivations contributing to MDP and to NMDP. If these four deprivations could be minimised or eliminated, it would be possible to eliminate MDP. Ensuring at least eight years of quality education for all, additional attention to households headed by persons who are unable to work, targeted measures to combat undernutrition, and the provision of sanitation facilities to deprived households are some of the interventions that can help in this regard.
Written by Wimal Nanayakkara for IPS Research Team
Contributions of Deprivations to MDP and NMDP
The first pie chart in Figure 1 show the magnitude of the contributions of deprivations to MDP. The second shows the corresponding contributions to NMDP. It is clear that the highest contributions to MDP and NMDP are from deprivations 1, 3, 4, and 7. For MDP, the highest contribution (24.5%) is from the lack of education; no one in the household has 6 years of education. This is followed by the two health-related deprivations, and the lack of access to improved sanitation. These four elements make up almost 75% of the deprivations contributing to MDP. In the case of NMDP, the main contribution is related to inability to work; head of the household is not working due to a chronical illness, disability or old age. This amounts to 33.9%. The other main deprivations are related to education, health, and sanitation. These four aspects account for 86.1% of deprivations contributing to NMDP.
Who are Battered by Multiple Deprivations?
Although the incidence of MDP in Sri Lanka is only 1.9% (around 400,000 persons), nearly 10% of the population or around two million people are in NMDP, which means they can slip into the former easily. Altogether, 2.4 million people (or 11.5% of the population) in Sri Lanka are either in MDP or NMDP. Figure 2 shows that households headed by persons who are retired / too old to work / disabled is the main socioeconomic group (SEG) facing multiple deprivations. This group records the highest incidence of MDP of 6.6% and NMDP of 31%. More than half of the people who are either in MDP or NMDP belong to this group. The other three SEGs with high shares of MDP or NMDP consist of households headed by agricultural labourers, non-agricultural labourers and skilled agricultural, forestry, and fishery workers. These four groups accounts for nearly 80% of those in MDP or NMDP.
Spatial Distribution of Persons in MDP or NMDP
The regions where a majority of the people in MDP or NMDP lives should be identified to develop area-specific strategies. In Sri Lanka, the highest number of persons in MDP or NMDP are in the Kandy district (9% out of the total number in MDP or NMDP in the country). Other districts with high shares of MDP or NMDP are Kurunegala (8%), Ratnapura (7.5%), Gampaha (6.6%), Galle (5.6%), and Matara (5%). It is also necessary to consider the incidence of MDP or NMDP or the percentages of persons in MDP or NMDP within each district. The incidence is highest in the Batticaloa district (19.5%), followed by Trincomalee (18.2%), Mullaitivu (16.4%), Kilinochchi (15.9%), Ratnapura (15.9%), and Kandy (15.4%). While the incidence of MDP and NMDP is low in some districts, the number of people living in poverty in absolute terms are high.
Figure 3 shows that the number of persons in NMDP in almost all districts is considerably high compared to those in MDP. This indicates that, although the incidence of MDP is low in Sri Lanka, a large number of people are at risk of slipping into MDP.
Monitoring all Dimensions of Poverty
The strategies to minimise MDP and NMDP depend on the types of deprivations faced by the poor, their locations, and their socioeconomic groups. Continuous monitoring of all dimensions of poverty and identifying the most threatened regions and groups are essential to eliminate all forms of poverty. Such information will be useful in developing region specific strategies.
As shown in Figure 1, there are four major deprivations contributing to MDP and to NMDP. If these four deprivations could be minimised or eliminated, it would be possible to eliminate MDP. Ensuring at least eight years of quality education for all, additional attention to households headed by persons who are unable to work, targeted measures to combat undernutrition, and the provision of sanitation facilities to deprived households are some of the interventions that can help in this regard.
Written by Wimal Nanayakkara for IPS Research Team Other Articles
-848028_550x300.jpg)
-847152_550x300.jpg)


Featured News
News 1st, MTV Channel (Pvt) Ltd, MBC Networks (Pvt) Ltd, 45/3, Braybrooke Street, Colombo-02.
T.P : +94 114 792 700,
Fax : +94 114 792 733
T.P : +94 114 792 700,
Fax : +94 114 792 733


 |  |  |
|---|---|---|
 |  |  |
 |  |  |
 |

.gif)